Geogebra Basics - Marking Points
In this post, I will be writing about how to plot or mark points in Geogebra - an online graphing calculator. So let’s begin straightaway.
I will be talking about plotting points in a 2D graphing calculator(there is a 3D equivalent too).
Geogebra has many tools that help us to construct points in different examples. The basic tool to draw a point is the Point tool found under the heading ‘Basic Tools’ in the Shapes menu. It can also be located under the heading ‘Points’.
We will select this tool by simply clicking on it. Its name will be blued and in bold after its selection. Once selected, we can mark a point anywhere on the graph with a simple left click of the mouse or a single tap on screen.
Now the obvious drawback is that the Point tool is not a good choice of selection for accurate evaluations. Say you want a point to appear at exactly the coordinates (1.83, 2.79). In such cases where we want to pinpoint the point, we could simply type in the coordinates in the input of the Calculator.
The point appears at the exact location as described. It is best to have the ‘Snap to Grid’ option selected in the settings of the graph if you are using the Point tool. Normally we opt to construct points at sharp corners of grids if location of points in the coordinate system is unimportant. This option will lay the point perfectly on the corner of the square in the grid even if you clicked a little bit away from that corner.
Plotting points is going to be at the heart of almost everything you do in Geogebra. Construction of an object or a shape in Geogebra would normally begin with a set of points. For example, let’s say you want to draw a circle passing through (1,1), (2,3) and (4,6).
We can define points at these locations by simply typing in the coordinates as three inputs. After that, using the tool Circle through three Points under the heading Circles, simply clicking on the three points to draw a circle through them. You can hide these points from the graph later on if you don’t want them to be seen in your project.
Select the tool Intersect which is found in the ‘Basic Tools’ section as well as in the ‘Points’ section. Click on two intersecting lines. It will return a point exactly at the location where the lines are intersecting. After that, just check in the calculator for its coordinates.
Another way to mark the intersection point is by simply using the Point tool and clicking at the spot(with ‘snap to grid’ option checkmarked).
Sometimes you will need to define a point exactly in the middle of two points, or exactly in the middle of a line segment(midpoint), but you don’t know where that middle is. Select the tool Midpoint or Center, found under the heading ‘Construct’. Just click on two points, a third point will appear exactly in their middle. Or click on a line segment to get its midpoint.
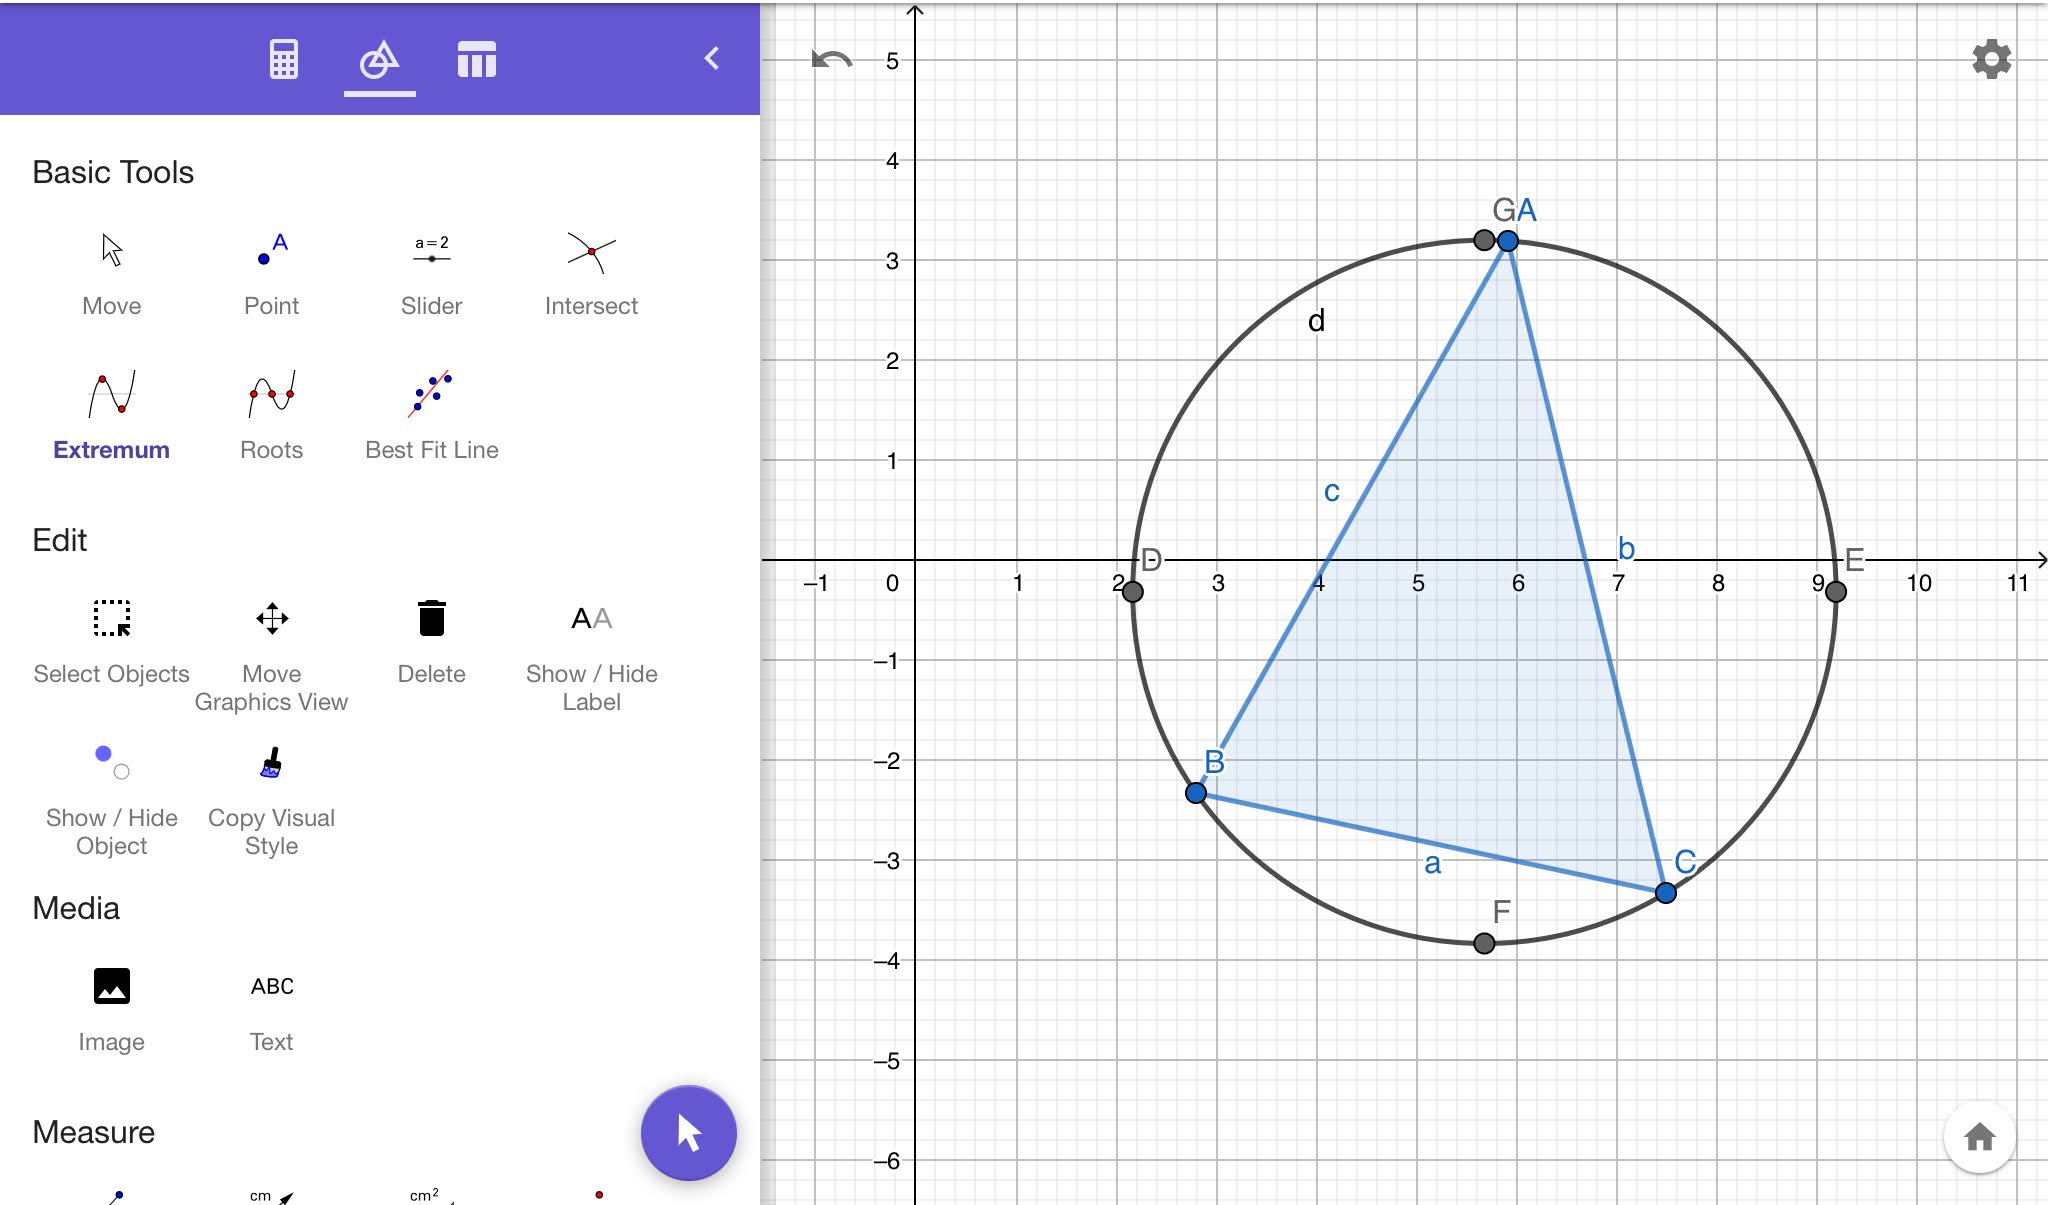
There is an Extremum tool under the ‘Basic Tools’ section. This tool returns the highest and lowest points on the graph of a function, hence the name Extremum. This tool is pretty useful if you want to find the location of the center of a circle. For example, say in a project you have constructed the circumcircle of a triangle by using the tool Circle through three Points, where three points are the three vertices of the triangle. Circumcircle is the circle which circumscribes a triangle.
You want to locate the center of this circle which is also called the circumcenter of the triangle. If you select the Extremum tool and click on the circle, it will return diametrically opposite pairs of points horizontally and vertically.
And now you can either use the Segment tool to connect the diametrically opposite points to get two diameters. The spot at which the diameters intersect is the location of the circumcenter, and you can mark it with a point using the Intersect tool.
OR, instead of constructing diameters, you can simply use the Midpoint or Center tool and click on any two diametrically opposite points. This will return a point exactly at the center which will be the circumcenter of the triangle.
I am sure there are other ways too by which we can determine the location of the circumcenter.
I have just covered few of the basic tools but there are lots of ways in which we can plot points in Geogebra depending on what kind of points they are.


Comments
Post a Comment